Outsourcing weld process development to an experienced contract welding service provider is common for many industries, including the manufacturers of flight critical components, turbomachinery, and precision medical parts as well as for small-scale research and development applications. Contract services may range from new process development to prototype welding to small- or high-volume production. Experienced contract welding service providers are usually staffed with knowledgeable welding engineers, technicians, and operators that are accustomed to difficult-to-solve and out-of-the-ordinary process needs. However, how does a client know that the process development was performed in a repeatable and consistent manner? This article illustrates a real-world example where the process behavior unknowingly changed over a two-day development effort.
Recently, a client approached us with data they had collected during a small-lot production effort performed by a well-known and reputable friction welding service provider. The application required the joining of dissimilar metals that are otherwise considered unweldable using conventional methods. Considering the difficult nature of joining these materials, the client chose to outsource the inertia friction welding process development and small-lot production.
The production involved welding fifty (50) parts over a two-day period. The process development and parameter optimization efforts were performed earlier in the year by the same welding service provider. While the client outsourced the welding development and small-lot production, all quality control activities, including visual inspection, metallography, non-destructive testing, and mechanical testing, were subsequently performed in-house by the client.
Even under the expert welding guidance of the service provider, this particular dissimilar material combination is marginally weldable at best. Furthermore, it is well known that even the slightest amount of surface contamination can result in a gross disbond. Therefore, in anticipation of ramping up production at one of the client's facilities, the client collected the in-process data with the hopes of establishing a baseline process behavior window to assist in the transition from the current small-lot production to a high-volume production environment.
During their offline, post-process analysis of the welding data, the client discovered a difference in the pressure behavior between day one and day two of the production effort. The process variability raised the following questions:
- Was the pressure variability significant?
- Was the change in pressure consistent across all welds on day two or was it an intermittent fluctuation?
- Was there other variability in the process?
- Did the change in pressure affect the bond quality?
- Can InnerVoice detect this type of process variability?
Therefore, the client contacted us to review the data and assist with the analysis. In response to the client's concerns, we imported the data into InnerVoice and explored the data. Below are some of our findings.
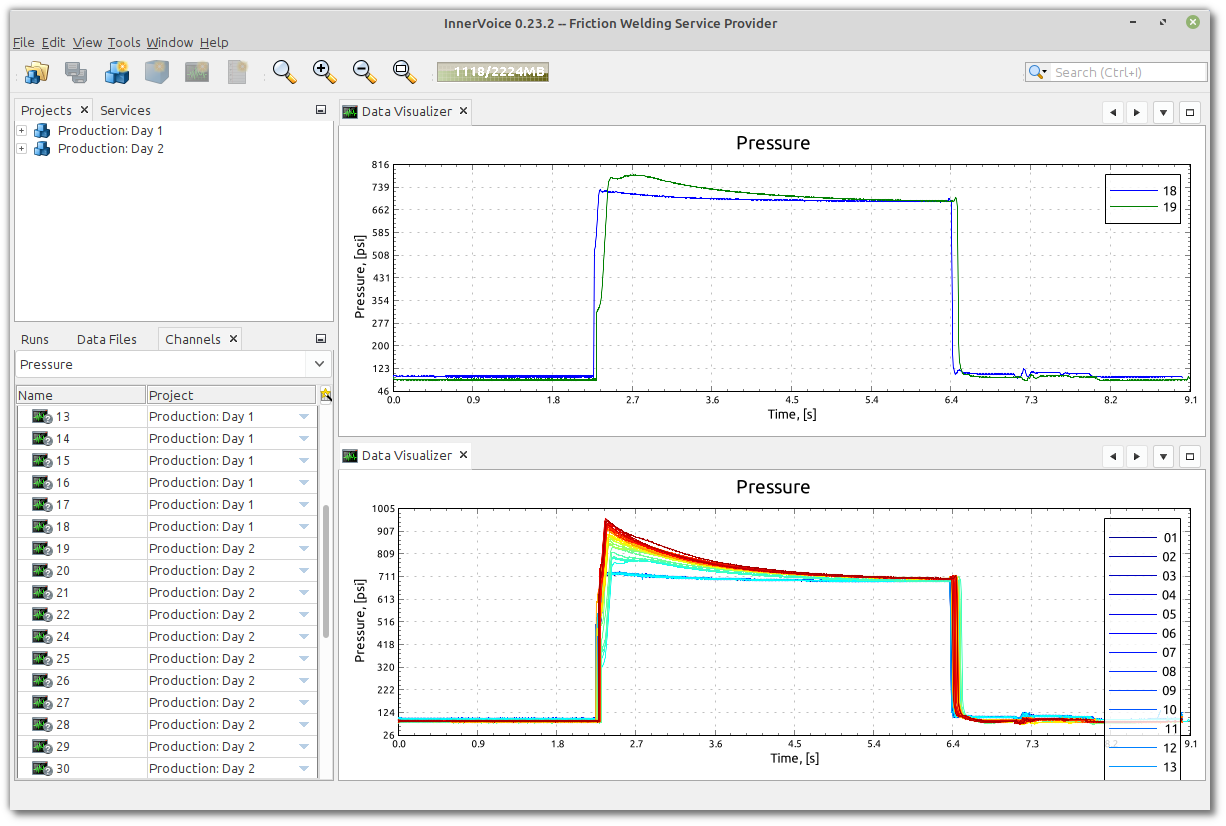
The screenshot below illustrates the difference in pressure between the first and second day of welding. The top plot compares the last weld of day one to the first weld of day two, while the bottom plot illustrates all fifty welds. Although a trend is slightly discernable in the bottom plot (that is, the overshoot peak in pressure appears to grow throughout day two), the raw, ill-defined data makes it difficult to draw any defensible conclusions.
To address the first two questions above, we turn to InnerVoice's feature extraction techniques and data exploration capabilities. The screenshot below illustrates the feature extraction results from several welds performed on day one and day two.
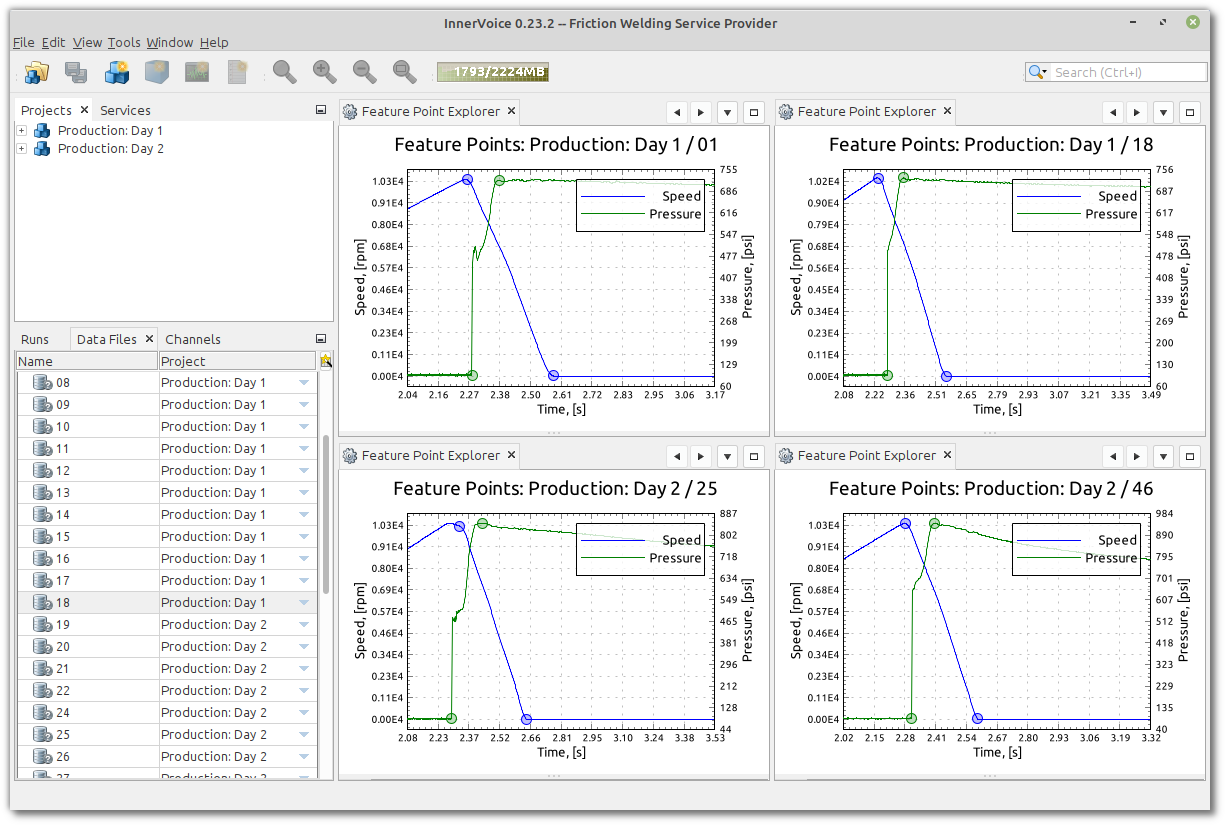
The four plots above show the feature points from the pressure and speed curves from four different welds. A feature point is a discrete point in time that represents a process-relevant and physically-meaningful event. At its most basic level, the inertia friction welding process can be summarized by the following six feature points:
- Speed:
- Feature Point 1: The point in time when the spindle reaches its setpoint speed.
- Feature Point 2: The point in time when the spindle decelerates to zero rpm and part seizure occurs.
- Pressure:
- Feature Point 1: The point in time when the pressure is initiated.
- Feature Point 2: The point in time when the pressure reaches its setpoint.
- Upset [1]
- Feature Point 1: The point in time when initial contact is made.
- Feature Point 2: The point in time when the majority of axial displacement is achieved (that is, the "knee" in the upset curve).
Once the feature points are established, more sophisticated data analysis and feature extraction can take place. However, the feature points themselves represent a significant improvement on the raw, ill-defined data and can provide valuable feedback beyond simply viewing the raw, time-domain data.
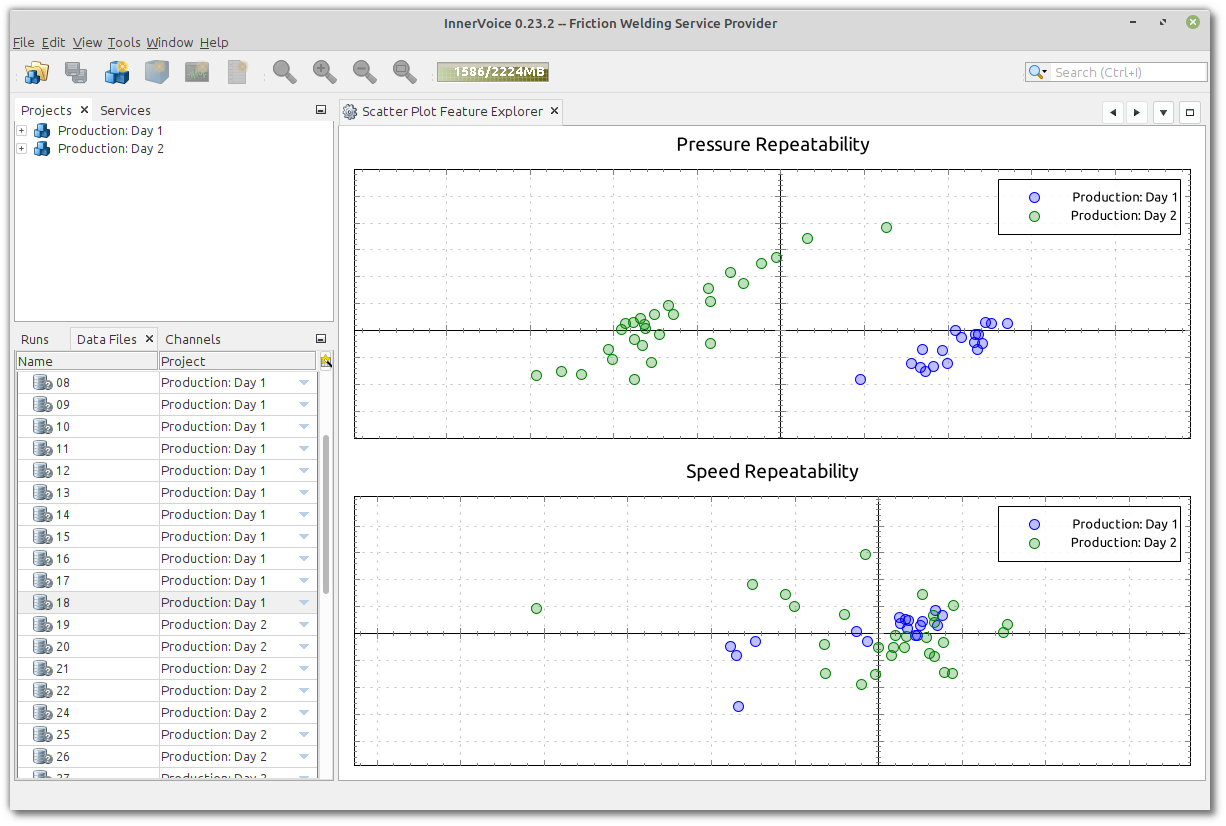
We can now explore the reduced data set of feature points using InnerVoice's "Scatter Plot Feature Explorer". This data explorer relies upon unsupervised machine learning techniques to decouple the oftentimes complex nature of the data and transform the high-dimensional data into a lower-dimensional subspace that is amenable to viewing. For this example, the data explorer allows us to compare all fifty welds using a two-dimensional scatter plot.
The screenshot below illustrates the data exploration results from the speed and pressure feature points [2]. The distinct grouping of the pressure data between day one and day two is clearly visible. The screenshot also illustrates that the feature points from the speed curve yield little discriminatory ability between day one and day two. Based on these results, we can conclude there is a clear and statistically significant difference in the pressure behavior between day one and day two, yet the process dynamics captured in the speed's feature points reveal little behavioral difference between the two days of welding.
Moving on to question three, "Was there other variability in the process?" For inertia friction welding, pressure is primarily a control variable. However, there can be response characteristics embedded in the pressure signal that provide insight into the process in terms of repeatability, consistency, and anomalous behavior. Characteristics like the rise time, the size and shape of the overshoot peak, and the subsequent damping behavior can be used in certain cases to capture process behavior and infer defective conditions like faying surface misalignment or improper seating of the part in the fixture. In the client's data set, we found no indications that additional anomalous behavior was embedded in the pressure signal.
Unlike pressure, speed is a response variable during inertia friction welding. In particular, once the spindle reaches its setpoint, the drive motor is disengaged, and the spindle's deceleration becomes a function of the setpoint speed, the inertial mass, and the material dynamics at the interface. This leads us to the following question, did the variability in pressure affect the spindle's deceleration? To address this question, additional feature analysis from the speed curve is warranted.
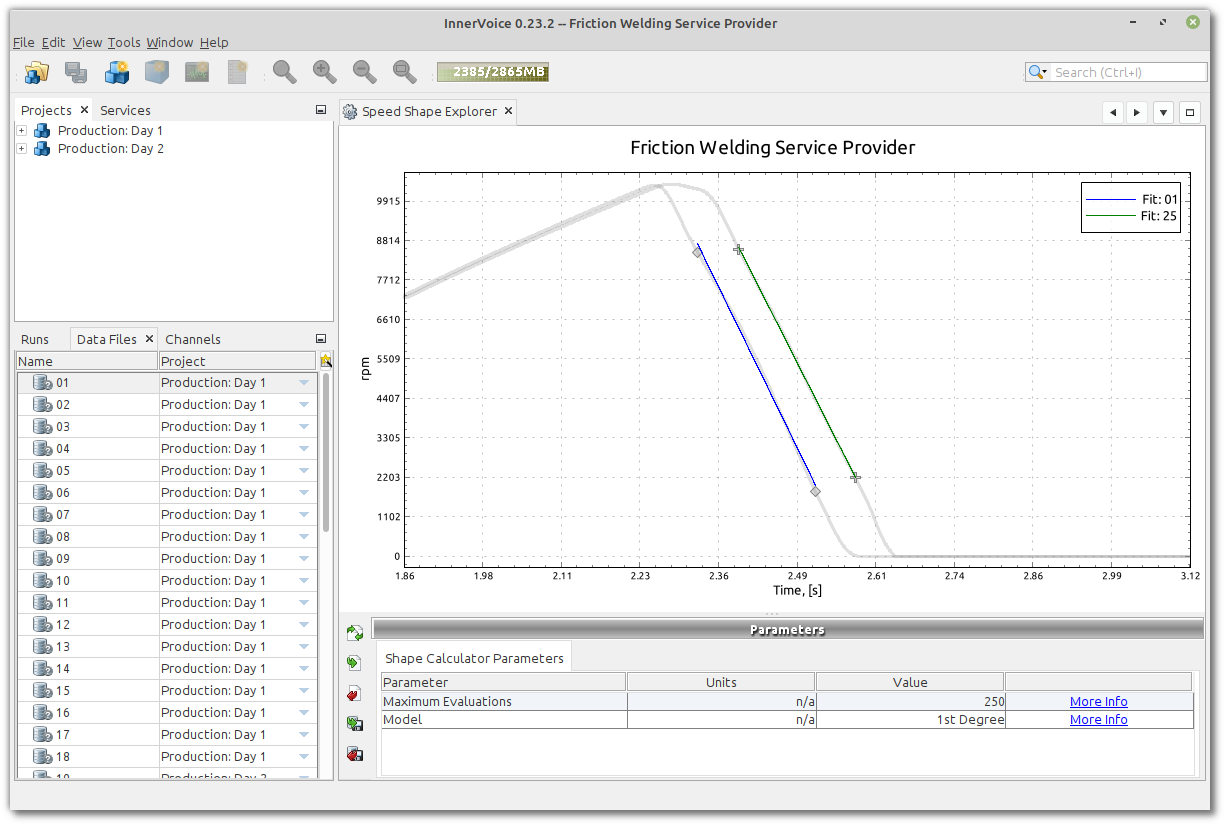
The screenshot below illustrates the feature extraction from the speed's shape during the deceleration portion of the signal. A linear fit was chosen to model the central section of the speed's deceleration shortly after part contact and prior to part seizure.
The features from the speed curve's polynomial model were calculated for all fifty welds. Once again, we used InnerVoice's "Scatter Plot Feature Explorer" to inspect the newly generated feature set. The screenshot below illustrates the results.
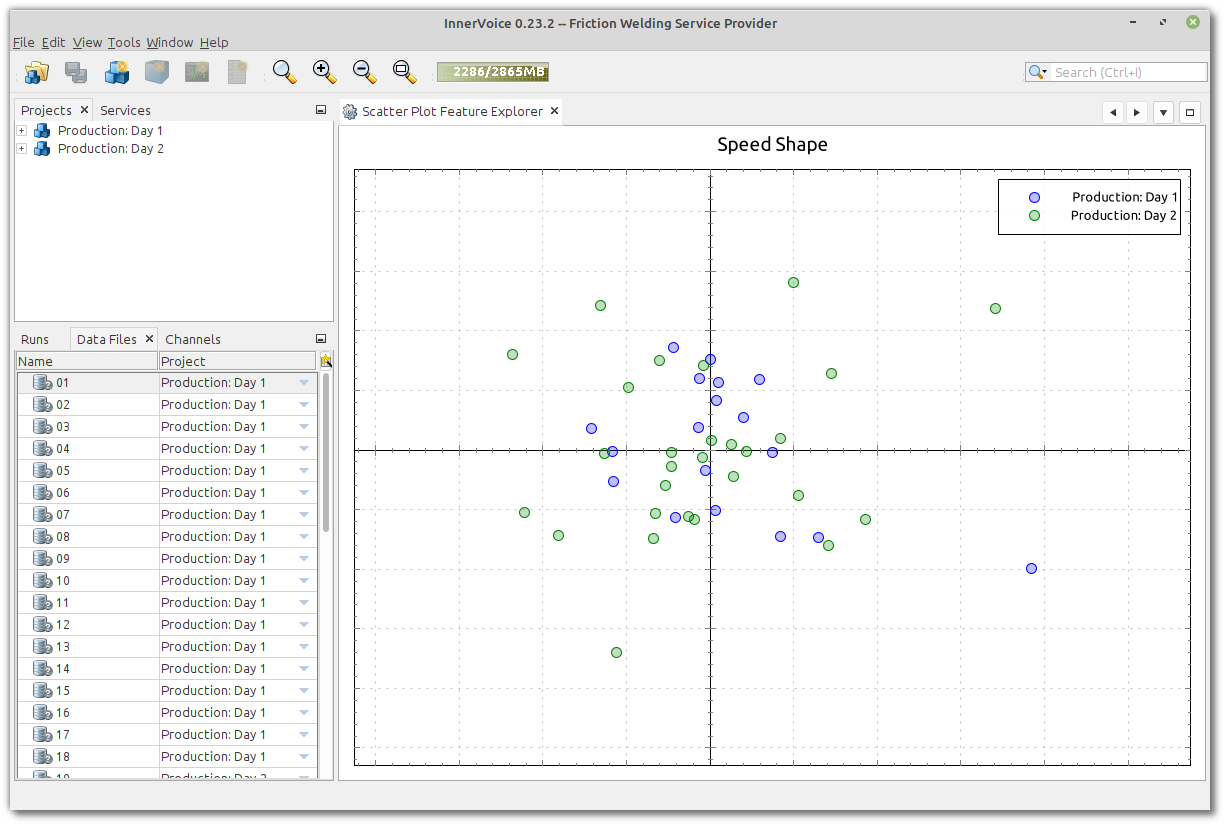
The scatter plot above indicates no discernable difference in the speed's nominal deceleration behavior between the welds conducted on day one versus day two. While the spread of the data may be a bit broader during day two, the overall distribution of the data is visually similar.
Other data analysis may be warranted. For example, are there differences in the speed curve immediately after impact or shortly before part seizure? Or is there a rise time difference in the pressure signal between day one and day two? These questions and the additional analysis are outside the scope of this article. However, we can say with relative certainty that the variability in the pressure behavior did not affect the speed's nominal deceleration characteristics.
Question four, "Did the change in pressure affect bond quality?", can only be addressed from the perspective of post-process, destructive and non-destructive testing. The client's post-process testing revealed no differences in bond integrity between the welds performed on day one and day two. This is a testimonial to the robustness of the inertia friction welding process and to the development of the process parameters through a properly planned and executed design of experiments. Even with slight variability in the pressure behavior, the process was able to produce high-integrity welds.
As illustrated in the example above, even though the operator dialed in the correct speed and pressure setpoints, the actual pressure during the second day of welding was characteristically different from the previous day. Does this matter? Well, that depends on the needs of the manufacturer, the nature of the weld, and the type of component being fabricated. It also depends on the manufacturing process and the tolerances of the machine, the workpiece materials and geometry, and the manufacturing environment. However, without this "in-process" knowledge, a manufacturer can be left troubleshooting a process with an incomplete picture.
Like most traditional manufacturing environments, quality is ensured through compliance, in terms of paperwork and machine knob settings, and extensive and costly destructive and non-destructive testing. However, as demonstrated above, this approach to manufacturing quality assurance has a clear and obvious blind spot. Knowledge of the machine's knob settings is an important but insufficient condition that the process was conducted in a repeatable and consistent manner.
Finally, we hope the answer to the last question is abundantly clear, "Can InnerVoice detect this type of variability?" InnerVoice eliminates the blind spot in a traditional manufacturing environment. It empowers the manufacturer with the knowledge to make informed decisions. InnerVoice represents the missing piece to the quality assurance puzzle. It redefines the past 100 years of conventional static thinking regarding manufacturing process characterization and control. The approach shifts our frame of reference from an outside point of view, in which the operations are the items on a work instruction sheet, to an inside point of view, in which the physical processes are interrogated and understood.
To learn more about in-process monitoring, see the following resources:
To learn more about the blind spot in a traditional approach to manufacturing quality assurance, see the following resource:
Or contact us today to learn more about how InnerVoice can help migrate your traditional quality assurance approach to an in-process approach.
--
[1] The upset data was not collected by the client. However, the final upset for each weld was recorded post-process and revealed no indication of abnormal process behavior.
[2] In InnerVoice, we refer to the feature points as "repeatability" metrics. The "repeatability" metrics answer the question, "Did the machine perform the way it was supposed to?" Once this question is addressed, additional and more sophisticated analysis can be applied (if necessary).


